General Ring Networks
Imports
[1]:
import torch
import numpy as np
import matplotlib.pyplot as plt
import photontorch as pt
from tqdm.notebook import trange

torch.manual_seed(42)
np.random.seed(33)
Add Drop Filter
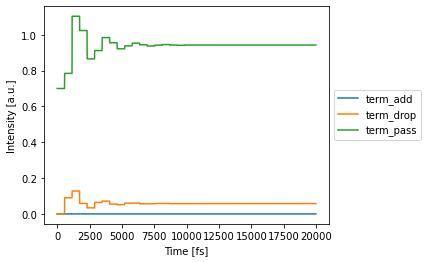
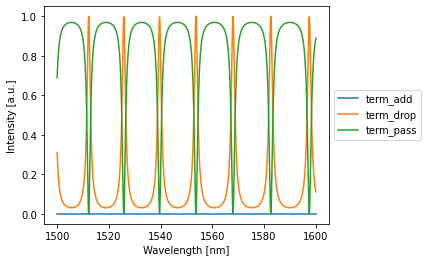
Let’s try to recreate the add drop filter in 02_add_drop.ipynb, but this time using the RingNetwork class:
[2]:
env = pt.Environment(
    dt = 1e-14,
    t_end=2000e-14,
    wl=1e-6*np.linspace(1.5, 1.6, 1000),
)
env
[2]:
| key | value | description |
|---|---|---|
| name | env | name of the environment |
| t | [0.000e+00, 1.000e-14, ..., 1.998e-11] | [s] full 1D time array. |
| t0 | 0.000e+00 | [s] starting time of the simulation. |
| t1 | 1.999e-11 | [s] ending time of the simulation. |
| num_t | 1999 | number of timesteps in the simulation. |
| dt | 1.000e-14 | [s] timestep of the simulation |
| samplerate | 1.000e+14 | [1/s] samplerate of the simulation. |
| bitrate | None | [1/s] bitrate of the signal. |
| bitlength | None | [s] bitlength of the signal. |
| wl | [1.500e-06, 1.500e-06, ..., 1.600e-06] | [m] full 1D wavelength array. |
| wl0 | 1.500e-06 | [m] start of wavelength range. |
| wl1 | 1.600e-06 | [m] end of wavelength range. |
| num_wl | 1000 | number of independent wavelengths in the simulation |
| dwl | 1.001e-10 | [m] wavelength step sizebetween wl0 and wl1. |
| f | [1.999e+14, 1.998e+14, ..., 1.874e+14] | [1/s] full 1D frequency array. |
| f0 | 1.999e+14 | [1/s] start of frequency range. |
| f1 | 1.874e+14 | [1/s] end of frequency range. |
| num_f | 1000 | number of independent frequencies in the simulation |
| df | -1.334e+10 | [1/s] frequency step between f0 and f1. |
| c | 2.998e+08 | [m/s] speed of light used during simulations. |
| freqdomain | False | only do frequency domain calculations. |
| grad | False | track gradients during the simulation |
[3]:
nw = pt.RingNetwork(
    N=2,
    capacity = 3,
    wg_factory = lambda: pt.Waveguide(length=50e-6/2, neff=2.86),
    mzi_factory = lambda: pt.DirectionalCoupler(coupling=0.3),
).terminate([pt.Source("term_in"), pt.Detector("term_pass"), pt.Detector("term_drop"), pt.Detector("term_add")])
with env.copy(wl=env.wavelength.mean()):
    detected = nw(source=1)
    nw.plot(detected)
    plt.show()

with env.copy(freqdomain=True):
    detected = nw(source=1)
    nw.plot(detected)
    plt.show()


Of course you can create much bigger and complicated ring networks, but that’s for another time.